Overall trade situation
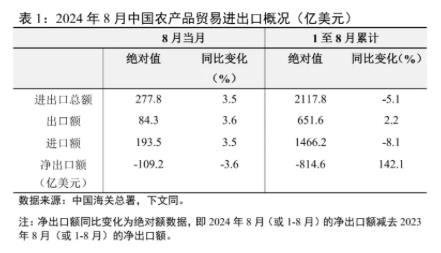
In August 2024, China's total import and export of agricultural products was US$27.78 billion, up 3.5% year-on-year; of which, exports were US$8.43 billion, up 3.6% year-on-year; imports were US$19.35 billion, up 3.5% year-on-year; net imports for the month were US$10.92 billion.
From January to August 2024, China's total import and export of agricultural products was US$211.78 billion, down 5.1% year-on-year; of which, exports were US$65.16 billion, up 2.2% year-on-year; imports were US$146.62 billion, down 8.1% year-on-year; cumulative net imports were US$81.46 billion.
Table 1: Overview of China's agricultural product imports and exports in August 2024 (US$ billion)

Product structure
1. Export product structure
In August 2024, China's agricultural product exports1 were mainly "edible vegetables, etc.", "meat, fish and other products" and "fish and other aquatic animals", with exports of US$1.0 billion, US$920 million and US$820 million respectively, accounting for 11.8%, 10.9% and 9.7% of all agricultural product exports (a total of 32.4%), and the growth rates were -4.3%, 5.4% and 2.7% respectively.
From January to August 2024, China's main agricultural exports were "edible vegetables, etc.", "meat, fish and other products" and "fish and other aquatic animals", with exports of US$7.75 billion, US$7.08 billion and US$6.45 billion respectively, accounting for 11.9%, 10.9% and 9.9% of all agricultural exports (32.7% in total), with year-on-year growth rates of 13.6%, -0.1% and -5.0% respectively.
2. Import product structure
In August 2024, China's main agricultural imports were "oil-containing kernels, etc.", "meat and edible offal" and "edible fruits and nuts, etc.", with imports of US$6.71 billion, US$1.90 billion and US$1.51 billion respectively, accounting for 34.7%, 9.8% and 7.8% of all agricultural imports (52.3% in total), with year-on-year growth rates of 13.6%, -18.9% and 17.3% respectively.
From January to August 2024, China's imports of agricultural products mainly include "fruits containing oil seeds, etc.", "meat and edible offal" and "edible fruits and nuts, etc.", with imports of US$41.53 billion, US$14.92 billion and US$13.96 billion respectively, accounting for 28.3%, 10.2% and 9.5% of all agricultural product imports (48.0% in total), with year-on-year growth rates of -14.9%, -20.6% and 2.5% respectively.
Import regional distribution and changes
In August 2024, China imported US$3.18 billion and US$1.60 billion of agricultural products from ASEAN and the EU, respectively, with year-on-year growth rates of 4.6% and -3.6%, respectively. China's top three agricultural product import trading partners are Brazil, the United States and Thailand, with import trade volumes of US$6.22 billion, US$1.22 billion and US$1.0 billion, respectively, with year-on-year growth rates of -2.7%, -10.4% and -10.3%, respectively.
From January to August 2024, China imported US$22.69 billion and US$11.90 billion of agricultural products from ASEAN and the EU, respectively, with year-on-year growth rates of -6.2% and -13.4%, respectively. China's top three agricultural product import trading partners are Brazil, the United States and Australia, with import trade volumes of US$37.83 billion, US$18.67 billion and US$8.43 billion, respectively, with year-on-year growth rates of 1.2% and -19.3%, respectively.
- Log in to post comments
